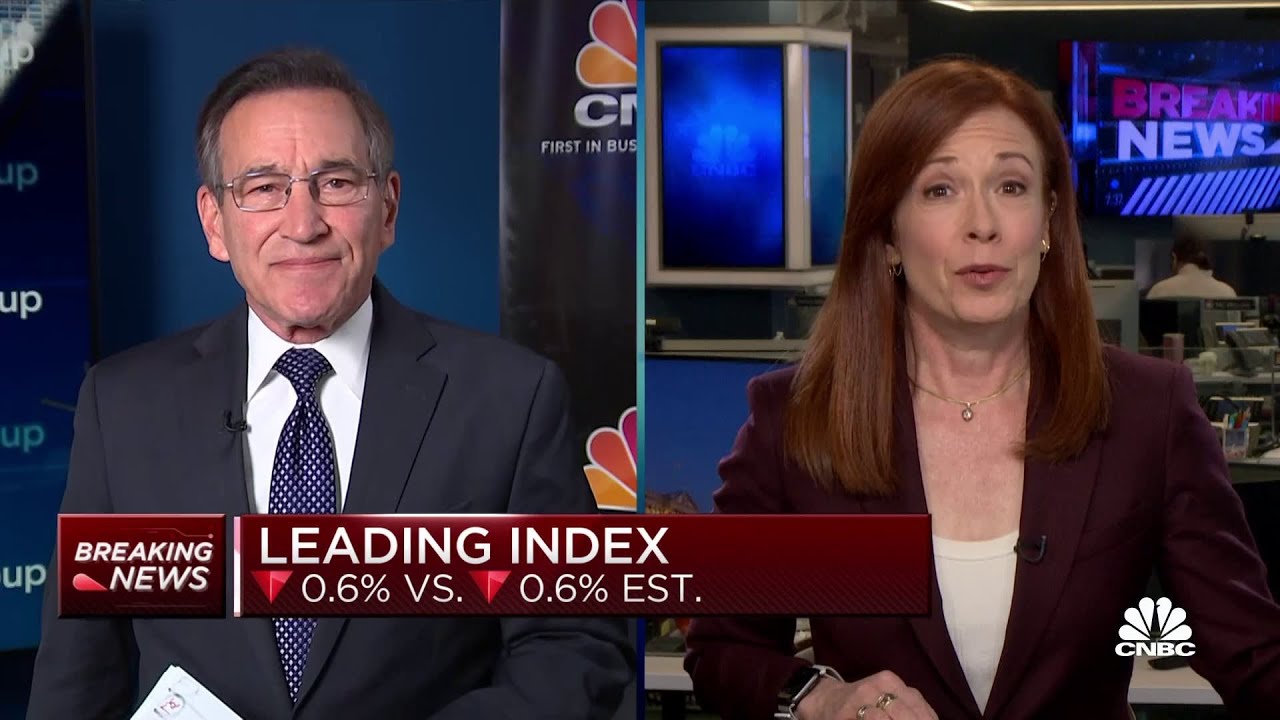
April Existing Home Sales Fall 3.4%; Leading Economic Indicators Down 0.6%
Unleash Your Creative Genius with MuseMind: Your AI-Powered Content Creation Copilot. Try now! 🚀
The stock of a traded company is down about 4%, and it's time to dig deeper into the economic indicators to understand what's happening. Rick Santelli brings us some fresh data that sheds light on the current state of the housing market.
Leading Economic Indicators: A Continuous Downward Trend
In April, the leading economic indicators took a hit, declining by 0.6%. This marks the 13th consecutive month of negative growth, rivaling the last major downturn from mid-2007 to early 2009, which saw a staggering 24 months of consecutive decline. These numbers are cause for concern and indicate a prolonged period of economic instability.
Existing Home Sales: A Disappointing Decline
Turning our attention to existing home sales in April, Diana He Olick provides us with some alarming figures. Sales fell by 3.4% to a seasonally adjusted annualized rate of 4.28 million units. This represents a year-over-year decrease of over 23%. Realtors attribute much of this decline to the persistently tight supply in the market.
At the end of April, there were only 1.04 million homes available for sale, an increase of just 1% compared to the previous year. However, given the current sales pace, this inventory level translates to a mere 2.9-month supply. In a balanced market, six months' supply is considered ideal. The scarcity of available homes is putting pressure on buyers and contributing to the overall slowdown in sales.
Regional Disparities and Skewed Median Prices
While analyzing regional trends, it becomes evident that price fluctuations vary significantly across different areas. In the Northeast and Midwest regions, home prices actually increased. The Midwest stands out as the most affordable region for prospective buyers. On the other hand, prices in the South and West experienced a decline. These regions had previously witnessed high demand and soaring prices, but now buyers are finding themselves priced out of the market.
It's important to note that the median price of homes sold in April was $388,800, reflecting a 1.7% decrease compared to the previous year. However, this figure is skewed by the types of properties being sold. Sales in the higher-end market, above half a million dollars, have been weaker. This further contributes to the overall decline in median prices.
Uncertainty Looms Over the Housing Market
The current state

Related Recaps
- tf2 | ugc-gaming experience
- What Are Words - Vu Cat Tuong (Cover) [MV Lyrics - Engsub + Vietsub]
- Former US ambassador William Courtney: 'Russia has never been more oppresive internally' | DW News
- TOMMY FURY AND KSI POST FIGHT INTERVIEW | THE PRIME CARD
- WHAT WENT WRONG W/ BAD BOY RECORDS??? JOC DETAILS IT ALL & ALSO HAS A MESSAGE FOR JUVENILE (PT 2)