Statistics 2020 Q2 Linear Regression And Correlation
Unleash Your Creative Genius with MuseMind: Your AI-Powered Content Creation Copilot. Try now! 🚀
Welcome, dear readers, to another exciting adventure in the realm of data analysis. Today, we're going to delve into the fascinating world of statistics, circa 2020. Imagine yourself embarking on a quest through the labyrinth of Excel, as we navigate the twists and turns of question two, a challenge involving linear regression and correlation. Brace yourselves, for we are about to embark on a journey into the vast unknown.
Unveiling the Mysterious Correlation
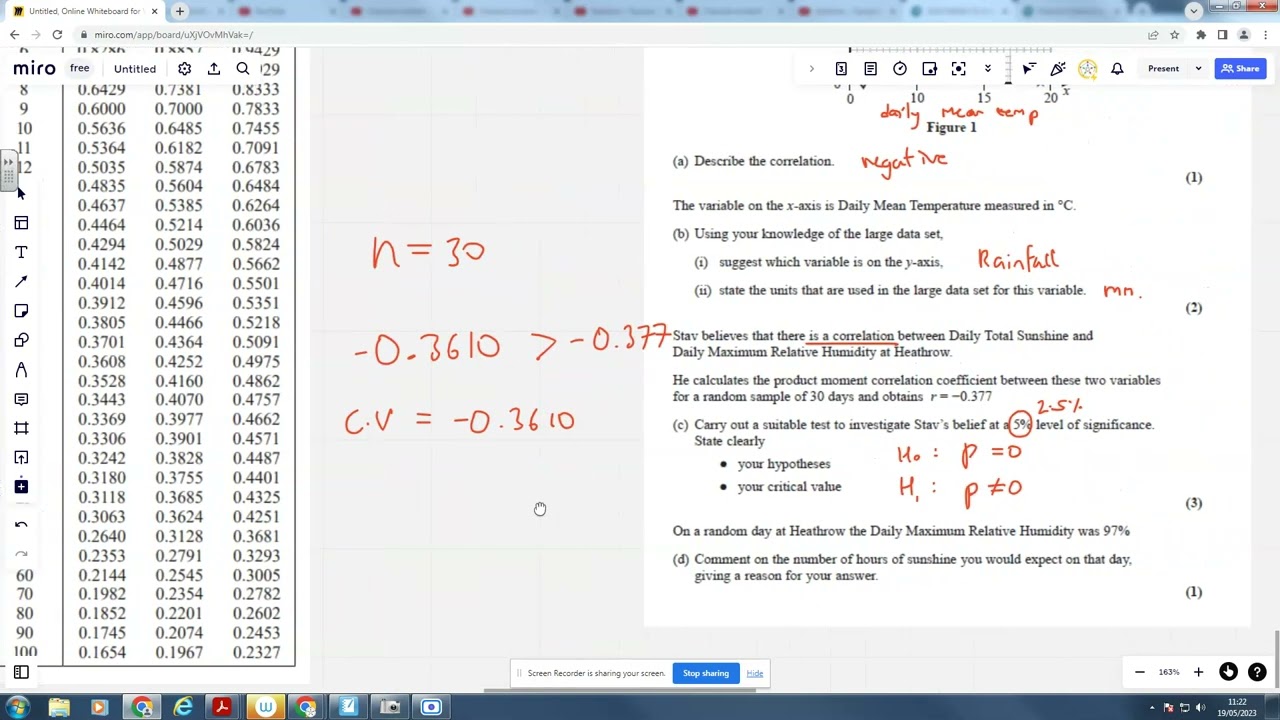
Our journey begins with a random sample of 15 days, plucked from the vast archives of Perth in June and July 1987. As we peer at the diagram in Figure One, we're tasked with deciphering the correlation between two enigmatic variables. It's clear that there's a tale to be told here, and it's a tale of negative correlation. The graph takes a downward trajectory, much like a thrilling rollercoaster ride, and the variable on the x-axis happens to be the daily mean temperature.
But, dear explorers, a riddle remains - what lies on the y-axis? Ah, fear not, for there is more than one possible answer. Could it be rainfall? The units, as we know, are measured in millimeters. As our data-driven ship sets sail, we shall soon uncover the truth.
The Sun and the Humidity: A Mysterious Dance
Let's fast forward to another intriguing scenario. Stav believes there's a connection between daily total sunshine and daily maximum relative humidity at Heathrow. To prove his theory, he invokes the power of the Pearson product-moment correlation coefficient (pmcc), which yields a result of R = -0.377 when n is 30.
The story this statistic tells us is crystal clear - as sunshine ascends, humidity descends, and vice versa. But, dear readers, is this correlation a mere illusion or a hidden truth? To unveil the answer, we must conduct a suitable test.
Hypotheses and the Duel of Data
In the world of statistics, we engage in the age-old duel of hypotheses. Our first protagonist is the null hypothesis, H0, which posits that there is no correlation, represented by ρ = 0. The null hypothesis is a worthy adversary that must be reckoned with.
But Stav believes otherwise. He contends that there is indeed a correlation between daily total sunshine and daily maximum humidity. The twist is that Stav doesn't declare whether it's a positive or negative correlation, rendering it a two-tailed test. So, as we prepare for battle, we must remember to halve our significance level, for this is no ordinary skirmish.
Our trusty table of critical values stands as our arsenal. With n at 30, we examine the enigmatic R of -0.377. It's a dance of numbers, but the truth is revealed - the critical value of -0.3610 emerges.
We must decide our stance, dear readers. Is our result more negative and closer to -1 than our critical value? The answer is a resounding yes! We declare victory, accepting the alternative hypothesis, H1, into our hearts.
In the end, we emerge with the conclusion that there is sufficient evidence to suggest that a correlation exists between daily total sunshine and daily maximum relative humidity. The game is afoot!
The Sunshine and Humidity Enigma Unveiled
But our adventure doesn't end there. On a seemingly random day at Heathrow, the daily maximum relative humidity soars to 97. Humidity reigns supreme, and we have the knowledge that humidity and sunshine share a mysterious connection - a negative correlation, to be precise.
So, how many hours of sunshine would one expect on such a humid day? The answer is clear. As humidity climbs, sunshine wanes. In our sample, the correlation was negative, and so our conclusion is that on this particular day, we would expect less sunshine than the average.
And there you have it, dear readers, a journey through the labyrinthine world of statistics, where correlations and hypotheses are our guiding stars. The art of data analysis unveils the mysteries of our world, offering insight into the unseen connections that shape our reality. Keep up the hard work, and the secrets of the data-driven universe will continue to unfold before your eyes.